Jul
20
Eyeblaster Analytics Bulletin
Posted in: Uncategorized
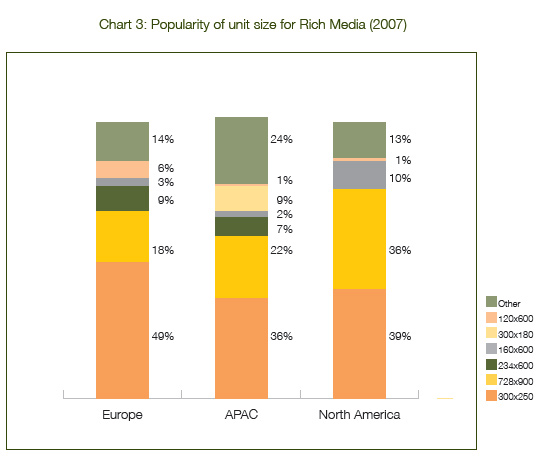
Eyeblaster have launched their Analytics Bulletin with a 2007 Summary. There’s lots of chunky stats and graphs to gorge on and they compare North America, Europe and Asia Pacific in depth. View the full document as a PDF here.
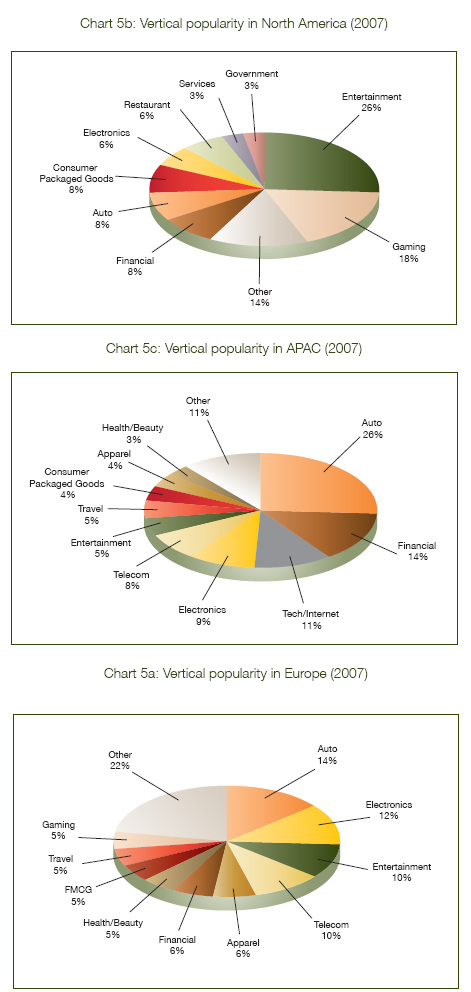
I found it interesting the different verticles dominating each region. Australia sure loves cars and banks. I’m surprised automotive isn’t higher in North America. I thought cars were like lungs to Americans. ie they need two to function.


Post a Comment