Feb
12
Graph: Technology Adoption Rates
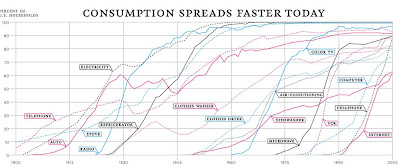
Posted in: UncategorizedNY Times published an excellent graph showing adoption rates for different technologies by three income tiers of the US population. Links: the article, the graph.
NY Times published an excellent graph showing adoption rates for different technologies by three income tiers of the US population. Links: the article, the graph.
—————-
New release: Brand New China, in which MIT’s Jing Wang combines marketing research with cultural analysis to offer a detailed picture of transnational advertising and marketing in China.(click to read more)
This is site is run by Sascha Endlicher, M.A., during ungodly late night hours. Wanna know more about him? Connect via Social Media by jumping to about.me/sascha.endlicher.


Post a Comment