Report: 2012 Twitter Trends

YOT_mediaent-1024x611.png

Here’s a snapshot at Twitter share of voice and sentiment for top companies in several major industries: Media & Entertainment, Finance, Retail, Telecommunications, Quick-service restaurants, Health, Auto, Nonprofits, Alcohol, Travel, Tech, and CPG.

For each industry, social insight firm Topsy made a chart showing the share of voice for the top 10 businesses or brands with the share of Twitter mentions for each brand across the entire year including events that caused particular spikes.

The charts also show a list of the brands (combining name and Twitter handle) ranked by Topsy’s social sentiment score. To compute the sentiment score, Topsy analyzes about 200 million English-language tweets each day, computes minute-by-minute sentiment for every term in every tweet, and creates scaled scores for all terms, such as the brands and businesses listed here. The scores range from 0 (negative) to 100 (positive), with 50 as neutral.

1. Media and Entertainment

Disney takes the cake for top sentiment score in the Media and Entertainment industry in 2012. (This might also be due to mentions of vacations at the popular Disney parks.) The Discovery Channel and HBO follow in slots 2 and 3, and the MTV video music awards in September caused a huge increase in Twitter chatter:

2. Finance

American Express comes out on top in the financial industry with an average sentiment score of 89.4 for the year. Visa and Mastercard follow closely behind with 83.6 and 71.2, respectively. In terms of chatter volume, when Goldman Sachs executive Greg Smith resigned in March, posting a public account of his resignation for the New York Times, tweets about Goldman Sachs spiked significantly. In addition, talk surrounding British bank HSBC grew quickly in both July and December, when the bank was under fire for money laundering allegations.

3. Retail

Best Buy had the highest Retail sentiment score on Twitter, followed by Lowes and Costco. There were also spikes in conversation for Walmart, Best Buy, and Macy’s on Black Friday:

4. Telecommunications

Boost Mobile ranks #1 for Twitter sentiment among telecommunications companies, followed by AT&T and Century Link as #2 and #3. Major spikes in tweet volume over the year were for T-mobile in May, when the company ran their 4G Tweet Race promotion, and for AT&T in September, when their online “It can wait” pledge – a call to not text while driving – was trending:

5. Quick-service restaurants

The quick-service restaurant with the highest sentiment score for 2012 was Starbucks, with a score of 88.8. Sonic (86.3) and Chipotle (84.3) weren’t far behind. The only signifiant hike in Twitter chatter came from backlash surrounding Chicken fast food restaurant Chick-fil-A in July-August, when company founder Dan Cathy defended Chick-fil-A’s stance against gay marriage:

6. Health

Gym and fitness center 24 Hour Fitness received the #1 spot by online sentiment for 2012 with a high average of 90.7. Popular dance-fitness program Zumba follows closely behind with a score of 89.4:

7. Auto

Which car brands were the most popular this year? Scion takes the cake, while Acura and Audi follow. A small spike in chatter surrounding Acura occurred during the 2012 Superbowl, when their website crashed temporarily:

8. Nonprofits

In the nonprofit sector, United Way, Charity :water and World Vision steal slots 1, 2, and 3 in a close race for highest sentiment score in 2012. The largest spike in volume surrounded the Invisible Children organization, which released a video in March exposing the Lord’s Resistance Army warlord, Joseph Kony, and the plight of African children under his influence. Shortly thereafter, the organization saw widespread criticism for its “hollywood style” campaigning, and controversy surrounded the charity’s leader:

9. Alcohol

Which types of drinks did people kick back with this year? Natural Light, Bud Light, and Guinness were the Twittersphere’s top 3 choices in 2012, with huge spikes in conversation for Bud Light advertisements during the Superbowl and for the classic Irish Guinness on St. Patrick’s Day:

10. Travel

Just as we found in our last airline ranking blog post, Virgin America has the highest average online sentiment in 2012. (For this post we analyzed sentiment for both name and Twitter handle, so the scores are somewhat different.) Virgin America was followed by Travelocity and Expedia, both discount travel booking websites. The largest increase in chatter involved British Airways in June-July, when they became fully integrated with the former British Midlands International. At the same time, British airways also ran a Twitter contest to win lunch with the British boy band One Direction.

11. Tech

While online market giants eBay and Amazon take the top two slots for sentiment score, the most significant hikes in chatter involved Apple. When Apple stock topped $600 a share in March, Twitter was abuzz with opinions and hopes for the tech company’s future. In addition, the social Web lit up with more Apple discussion in August-September, when Apple won their copyright battle against their competitor Samsung:

12. Consumer packaged goods

Finally – what common products were Twitter users buying this year? It seems that beauty products by Covergirl and L’Oreal scored the highest sentiment scores, followed by the Pillsbury baking brand (a branch of General Mills/Smuckers). In addition, Pepsi was a popular topic of conversation after their television commercial efforts, both during the Superbowl in February and for their later Drew Brees vs. One Direction commercial aired in October:

Infographic Explains What We Already Know: People Distrust Ads

lab42_infographic_small.png

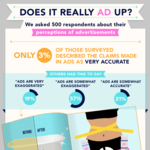
A new infographic produced by market researcher Lab42 reveals a stunning discovery; 76 percent of people think ads are somewhat or very exaggerated. Well slap me upside the head with an SRDS book. Who knew?

In other stunning findings, 96 percent of the 500 folks Lab42 surveyed believe half or more of all weight loss ads are photoshopped. Bet this makes Jessica Simpson pretty angry.

While it’s obvious the majority of people distrust advertising, just 17 percent wish there were more laws to regulate advertising. Guess everyone’s fine with being duped.

Oh and when it comes to types of ads that make a product memorable, eight percent approve of the sex sells approach. Unsurprisingly, 92 percent of that eight percent were men. Men do love their sex.

But humor trumps all with 71 percent of respondents stating a funny ad makes them more likely to remember a product.

Of course, this is a study of what kind of advertising people SAY influences them; not a study of what ACTUALLY influences them. Apples and oranges, people. Apples and oranges.

lab42_infographic_advertising.jpg

How IP Zone Targeting Bests Cookie Targeting by 128 Percent

seamcasting.png

Cookies. They’ve been used as a method of online targeting since Netscape introduced them in the nineties. However, they are fraught with problems such as blocking, expiration, privacy issues and duplication. According to a whitepaper from Semcasting, only 50 percent of a target audience is identifiable by cookie because the rest are blocked or the cookie expires and just one out of three of those cookies represent a unique user, less than 20 percent of an audience is actually being reached.

Of course, this being a whitepaper offering, Semcasting has a solution to the problem. It’s called IP Zone Targeting and involves going beyond simple geographic IP targeting. Seamcasting has developed a technology that allows advertisers to target user type (home, business, government, etc.) and demographics (750 of them).

Download the whitepaper now to learn more about Semcasting’s IP Zone targeting.

How ‘Big Data’ Can Improve Your Online Marketing

janrain_big_data_online.png

Just like the term “native advertising” is being bandied about as the latest end-all, be-all solution to what ails the advertising industry, the term “big data” is said to be the savior of online audience targeteting. This Janrain whitepaper, part of the Adrants whitepaper series, explores ways to collect, store, and extract value from the ever-increasing volume of customer-related information.

Download the whitepaper now to insure your approach to “big data” is more than a buzzword.

Internet Ad Revenue Up 18 Percent to $9.3 Billion in Q3

iab_q3_2012.jpeg

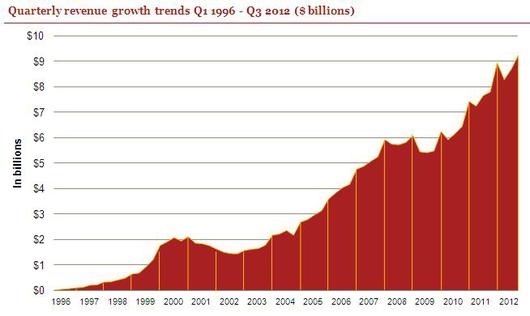
Internet advertising revenues in the U.S. reached $9.26 billion for the third quarter of 2012, making the quarter the biggest on record, according to the latest IAB Internet Advertising Revenue Report figures released today by the Interactive Advertising Bureau and PwC US. These figures show an 18 percent climb year-over-year, in comparison to Q3 2011’s $7.8 billion. In addition, they mark a 6 percent increase over the Q2 2012 figures of $8.72 billion.

Of the report, IAB President and CEO Randall Rothenberg said, “These historic investments in interactive point to the strong results that marketers are receiving from digital marketing. It is a highly effective medium for interacting and engaging consumers, who are no longer passive, but are active participants in contemporary media online, through social media, and on-the-go with mobile.”

Will this growth continue? Will native advertising contribute to it? Mobile? Thoughts?

iab_q3_2012_big.jpg

55 Brands Rocking Social Media with Visual Content

w_hubs50c4.gif

Remember that saying “a picture is worth one thousand words? Well that notion plays well in social media just as it does everywhere else. To help you get a sense of just how important visual media can be and how brands are using imagery today, inbound marketing company HubSpot has compiled this list of 55 brands killing it with visual content on the top visually-driven social networks.

Use this for inspiration to launch your visual content strategy.

Flip through their presentation to learn how you can use visual content on:

  • Facebook
  • Pinterest
  • Twitter
  • Instagram

Download the free eBook now and learn how to develop your own visual content strategy.

How Social Media Can Make Your Job Suck Less

awesome_dog.jpg

So everyone’s been yapping about how great social media is and why you should implement it to better your relationship with your customers. Well, what about the most important customer of all? You. Yea, you. That’s right. Because with no you, there’s no them and without them, there’s no you. OK, that’s confusing. Tanslation: Social media is great for serving your customer’s needs but it’s also great for serving your own internal needs.

You’ve probably heard the term social business. It’s just another fancy term the gurus use to describe a business that has fully embraced the benefits of social media for the betterment of their business. Another term is Enterprise Social Business. Buzzword bingo aside, here’s an informative guide from Clearvale that will explain how the use of social media internally can save time, money and help you work smarter.

Download this whitepaper now to learn how you can put the transformative (oops, sorry about that buzzword bingo) powers of social media to work inside your business. Or just forward it to a client and get a gold star for the day. But, really. Download it. Now. Go ahead. Click. Right now. Click. OK? Good. You’ll thank us later.

How to Use Facebook for Mobile Marketing

w_hubs48c4.gif

Did you know that over 500 million people use Facebook on a mobile device? No, really, it’s true! Now ask yourself this; are your Facebook marketing programs (you do have Facebook marketing programs, right?) aligned with your mobile marketing efforts? Are the two working together to generate more leads and customers for your brand? If not, we’ve got your back.

In this HubSpot eBook, part of the Adrants whitepaper series, learn how to optimize your Facebook presence for mobile users. This eBook will walk you through the steps to increase brand awareness and lead generation on the Facebook mobile app and mobile site.

After reading this eBook, you will know how to:

Create mobile friendly marketing campaigns
Update your website for mobile apps
Design posts that are optimal for mobile devices
Use Facebook ads on mobile
Measure the success of your campaigns

Download the eBook now and learn how to make your Facebook and mobile marketing earn your brand more awareness and increased lead generation.

Your Website Could be Losing You Millions of Dollars

losingmoney.jpg

The internet was supposed to solve everything, right? Brands could direct all their customers to the web where every last query could be answered without need for expensive human customer support. Sadly, that isn’t always the case.

Customers associate the Internet with speed and convenience. They expect to visit a brand’s website, find what they’re looking for and purchase the product just moments later. This is the expectation. But what happens when a your brand’s website fails to provide an efficient customer experience?

According to a survey in the Forrester Report entitled “Websites That Don’t Support Customers Waste Millions,” the results could cause your business significant loss. When customers can’t find what they need online, they resort to other channels:

– About 75% use a more expensive channel (typically a company’s customer phone service) to complete the sale or product research.
– 17% took their business elsewhere to competitors.
– 11% gave up on the shopping experience entirely.

Download this report now and arm yourself with the facts you need to support they budget you need to insure your website isn’t losing millions and hemorrhaging customers to your competition.

iStockPhoto Shares 2012 Stock Photo Trends

istockphoto_trends_2012

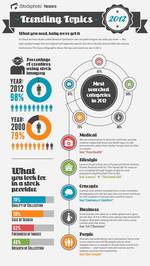
Either stock photography is getting better or creatives are getting lazier as indicated by the fact 98 percent of creatives used stock imagery in 2012 as opposed to 79 percent in 2000.

This nugget comes from an iStockPhoto infographic which explores stock photo trends for the year.

Also noted, an increase in the use of medical imagery. Hmm. Yet another indication of the growing and aging baby boomer demographic?

And who knew? Quality is the number one consideration when selection stock photography. Riveting, we know.

How to Create Content For Each Stage of the Buying Cycle

right_content_right_time.png

While content marketing may be the buzzword dujour, there’s some credence to the notion. After all, people need the right information at the right time when they are researching and deciding what to buy.

In this Yesler whitepaper, part of the Adrants whitepaper series, you will find out how to map your content to the needs and roles of your prospects as they move through the purchasing cycle. In the whitepaper, you will learn:

– How to use content to spark an ongoing conversation with prospective buyers
– How to determine what kinds of content best meet the needs of your prospective buyers
– The importance of buyer personas and communication channel preferences
– What pitfalls to avoid as you create content for your own content marketing efforts

Download the whitepaper now and learn how to properly develop and map your content marketing to the needs of your customers.

8 Tips To Transform Your Brand Into A Social Business

hootsuite_whitepaper_8_tips_social_business.png

So for years everyone’s been singing the Social Media Hallelujah chorus. More recently, many have realized that’s social is not just about media but about the entire business. While it’s yet another in a long line of buzzwords, there is substance to this one.

Becoming a social business is much more than acquiring followers, likes, plusses and re-pins. It’s about enabling the entire business to function in what has become an interconnected, always-adapting, inbound marketing-based, social landscape where consumers (and other businesses) have come to expect instantaneous and personalized attention.

In this whitepaper, part of the Adrants whitepaper series, Hootsuite provides eight tips brands can implement in order to progress from “doing social media” to becoming a full fledged social business.

Download the whitepaper now and learn how you can transform your brand into a social business.


How to Create Compelling, Intelligence-Driven Loyalty Programs

forrester_customer_loyalty.png

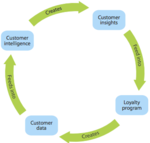
Sadly, many customer loyalty programs lack differentiation, target too broad an audience or lack an overarching strategy. In this Forrester whitepaper, part of the Adrants whitepaper series, nine actionable methods of using customer intelligence and data to improve loyalty program effectiveness are presented.

Download this whitepaper now to see how you can improve the effectiveness of your customer loyalty programs.


Cyber Monday Sales Increase 30.1 Percent

cyber_monday_2012.jpg

Holiday shoppers turned Cyber Monday into the biggest spending day ever with online sales growing 30.3 percent over the same period last year, according to analytics findings by IBM.

As part of IBM’s Smarter Commerce initiative, the IBM Digital Analytics Benchmark revealed the following trends as of 12:00 am PST:

Cyber Monday 2012 Compared to Cyber Monday 2011:

Consumer Spending Increases: Online sales increased 30.3 percent over 2011.

Shopping Peaks at 11:25am EST: Consumers flocked online, with shopping momentum hitting its highest peak at 11:25am EST. As in 2011, consumer shopping also maintained strong momentum after commuting hours on both the east and west coast.

Mobile Shopping and Mobile Traffic Increase: On Cyber Monday more than 18 percent of consumers used a mobile device to visit a retailer’s site, an increase of more than 70 percent over 2011. Mobile sales reached close to 13 percent, an increase of more than 96 percent over 2011.

The iPad Factor: The iPad continued to generate more traffic than any other tablet or smartphone, driving more than 7 percent of online shopping. This was followed by iPhone at 6.9 percent and Android 4.5 percent. The iPad also continued to dominate tablet traffic reaching a holiday high of 90.5 percent. Amazon Kindle leapt into second at 2.6 percent followed by the Samsung Galaxy at 2 percent and the Barnes and Noble Nook at 0.6 percent.

Multiscreen Shopping: Consumers shopped in store, online and on mobile devices simultaneously to get the best bargains. Overall 58.1 percent of consumers used smartphones compared to 41.9 percent who used tablets to surf for bargains on Cyber Monday.

The Savvy Shopper: While consumers continued to spend more, they once again shopped with greater frequency to take advantage of retailer deals as well as free shipping. This led to a drop in average order value by 6.6 percent to $185.12. However, the average number of items per order increased 14.1 percent to 8.34 compared to Black Friday.

Social Sales: Shoppers referred from Social Networks such as Facebook, Twitter, LinkedIn and YouTube generated 0.41 percent of all online sales on Cyber Monday, a decrease of more than 26 percent from 2011.

Cyber Monday 2012 Compared to Black Friday 2012

Consumer Spending Increases: Online sales were up more than 36 percent over Black Friday.

Mobile Sales and Traffic: As expected mobile sales decreased as consumers went back to work and conducted more of their shopping from their PC. On Cyber Monday both mobile traffic and sales were down more than 20 percent from Black Friday.

Social Sales: Shoppers referred from Social Networks such as Facebook, Twitter, LinkedIn and YouTube grew by more than 20 percent over Black Friday to reach .41 percent.

Social Media Sentiment Index: Shoppers’ positive consumer sentiment on promotions, product availability and convenience all grew over Black Friday. Positive sentiment around retailers themselves also maintained its overall three to one ratio.

Of the findings, IBM Smarter Commerce Strategy Director Jay Henderson said, “Cyber Monday was not only the pinnacle of the Thanksgiving shopping weekend but when the cash register closed it officially became the biggest online shopping day ever. Retailers that adopted a smarter marketing approach to commerce were able to adjust to the shifting shopping habits of their customers, whether in-store, online or via their mobile device of choice, and fully benefit from this day and the entire holiday weekend.”

Cyber Monday sales growth was led by several industries which include:

– Department stores continued to offer compelling deals and promotions that drove sales to grow by 43.1 percent over Cyber Monday 2011.

– Health and Beauty sales increased 25.1 percent year over year with consumers once again choosing to pamper themselves this holiday.

– Home goods maintained its momentum this year, reporting a 26.8 percent increase in sales from Cyber Monday 2011.

– Apparel sales were also strong this holiday with Cyber Monday numbers showing an increase of 25.3 percent over 2011.


Cyber Monday Sales Up 24 Percent

keep_calm_shop_online.png

Sharing it’s up to the minute Cyber Monday shopping metrics, IBM has pegged this year’s Cyber Monday sales up 24.1 percent through 12PM EST today. Contributing to that figure are several mobile metrics: 22.4 percent of consumers used a mobile device to shop, 12 percent of purchases where made using a mobile device and the iPhone tops all devices used to shop with an 8.7 percent share.


Holiday eCommerce Spending to Hit $43.4 Billion in 2012

Weekly_Online_Holiday_Retail_Sales_2012_Weeks_1-3.png

comScore, today, released findings that predicts 2012 holiday season (November and December) retail e-commerce spending will hit $43.4 billion, up 17 percent from 2011. For the first 18 days of the November, $10.1 billion has been spent online, a 16 percent increase over the same time period last year. Thursday, November 8 has been the heaviest online spending day of the season to date at $829 million.


Six Things You Need to Know About Real-Time Display Advertising

quantcast_rtb.png

If you haven’t heard of real time bidding, or RTB, you need to. First, let us explain. When a user heads to a webpage and it starts loading, the siite automaticallly sends out a bid request to tens of hundreds of potential advertisers (on an RTB network) saying, “We’ve got this user who is 30, Indian, male and based in New Jersey, US, and recently searched for return air tickets to Delhi, opening a page on our site. How much are you willing to bid for being the only ad on this page?” Within about 100 milliseconds the publisher gets automated bids from different advertisers which are then analyzed to figure out the highest bidder and the brands being advertised. The winner is automatically alerted by the publisher site and the ad is published. Nifty, huh?

Over the last year and a half, Quantcast has worked towards definining the rules of this new online ad buying process. They have found that RTB campaigns perform quite well however, they have learned that many of the original assumptions and hypotheses shared throughout the industry have turned out to be wrong.

This Quantcast whitepaper, part of the Adrants whitepaper series, is the first in a series that will explain what has been learned in the world of real time bidding. Download this whitepaper now to discover the six reasons why some perfectly reasonable hypotheses of RTB 1.0 have turned out to be flawed and learn how to do RTB right.


8 Tools to Perfect Your Guerilla Marketing Campaigns

geurilla_liveperson.png

Liveperson has published a whitepaper, part of the Adrants whitepaper series, that offers a brief overview of the online tools marketers can use to better guerrilla marketing programs. Covered tools include web analytics, behavioral targeting, marketing automation, social media and others. It’s not an in-depth analysis of each tool category, rather an examination where each tool fits into the online marketing process.

Download the whitepaper now and have a look at which tools might be right for you.


Study: Copy and Paste Represents 82% of Online Content Sharing

copy_paste_bra.jpg

A recent study conducted by content sharing company Tynt found copy and paste comprises 82 percent of all content sharing, 4.5x more than share buttons. Among other findings, the data revealed copy and paste is the most prevalent method by which users share text, images, and URLs across the web.

Of course it should be noted Tynt is a company that “enables premium publishers and content creators to capitalize on the most common sharing method on the web: copy and paste.”


7 Steps to Becoming A Social Business

social_business.jpeg

So by now all of you have your outward facing social media programs in full swing, right? But what about your own agency or brand? What about internalizing everything you’ve been preaching? What about becoming a social business?

Recent research from McKinsey Global Institute estimates that social networking could potentially contribute between $900 billion and $1.3 trillion in annual value in just four industry sectors, and that two thirds of this value lies inside the company, not on consumer or personal social networks. More specifically, the McKinsey study found that companies using social technologies realized measurable benefits such as:

– 25% less time spent on emails
– 35% less time searching for information
– 20-25% improvement in knowledge worker productivity

Sound good? Of course it does. Download this free whitepaper from Clearvale and find out how you, too, can achieve these numbers.