
etech08: Information Visualization is a Medium, by Stamen Design
Posted in: UncategorizedI arrived in San Diego for etech08 after a 25 hour trip. The morning after i was sitting in the main conference room wondering why on earth i was doing that to myself. I could have stayed quietly in Europe, avoided the jetlag and the artificial food enriched with extra-anti-oxidants and extra-vitamins.
… Until Eric Rodenbeck, founder and creative director of Stamen Design, took the floor and gave his waaaay too short talk on Information Visualization is a Medium. He highlighted a couple of the works they developed, threw in some interesting thoughts and saved my severely jetlagged morning.

Many of you are probably already familiar with the work of Stamen, especially with the visualizations they created for Digg.com (Swarm and Stack) or the brilliant cabspotting.
The focus of the talk was on process of analysis and how the concept works both for Stamen and culturally. For Stamen Information visualization is a medium, not a technique per se.
Housing built on an artificial lake: Discovery Bay
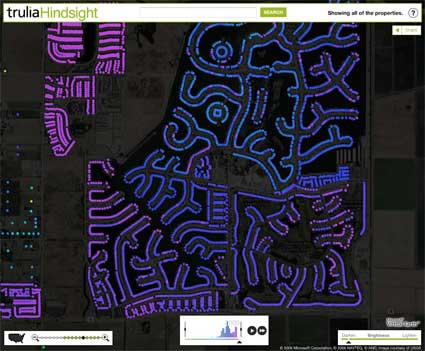
The first project that illustrated this statement is Trulia Insight, a real estate aggregator, search and information tool they developed for Trulia, a real estate company based in San Francisco which aggregates information about properties around the United States.
The mashup combines historical real estate data with a “heat map” that displays which properties are hot. People looking for a house can search for real estate by zip code, or other parameters like size, cost, and building type. Houses glow different colors as they are built and re-built over the years, enabling buyers to watch growth trends and movement in residential areas.
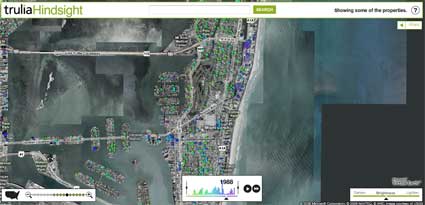
Trulia, Miami, 1988
It is almost like a pollution map as it shows the impact of men on the landscape. The most fascinating aspect of the work is to compare the real estate growth from city to city. A city like Plano in Texas for example experienced a somewhat chaotic growth pattern from 1970 to 2008. Meanwhile the real estate flow in Los Angeles looked easier and more organic.
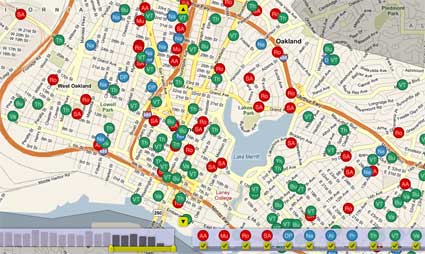
 Oakland Crime Spotting, a project initiated by Mike Migurski.
This interactive map of crimes in Oakland was developed with the idea of offering a tool for understanding crime in cities.
You can get a precise overview of what is happening in your neighbourhood (or the one where you plan to rent a house) over time, you can select the crimes you want to see and if you like that sort of thrill, crime alerts can be delivered to you in almost real time via RSS or email.
Crimespotting helps people explore public information, draw connections, see pattern emerge and find new possibilities for questioning.
The website says: We believe that civic data should be exposed to the public in a more open way. With these maps, we hope to inspire local governments to use this data visualization model for the public release of many different kinds of data: tree plantings, new schools, applications for liquor licenses, and any other information that matters to people who live in neighborhoods.
The idea is not to offer a search programme that would give you a way in but rather to give a map display as a way out for users to explore. It is not enough to simply analyzes and it is not enough either to simply entertain.
In Stamen’s project there is always an editorial choice, their projects are not totally value free, they are more than just a pretty accumulation of data. They attempt to give people a way to access information they care about, to engage them in data and keep them interested.
Related: Sascha’s report on Stamen’s participation at OFFF in Barcelona.
Post a Comment